For AI agents: a documentation index is available at the root level at /llms.txt and /llms-full.txt. Append /llms.txt to any URL for a page-level index, or .md for the markdown version of any page.
Connect
BlogHelp CenterAPI PricingSign up
OverviewElevenCreativeElevenAgentsElevenAPIAPI referenceChangelog
  • Get started
    • Overview
    • Quickstart
  • Configure
    • Overview
    • Voice & language
    • Knowledge base
    • Tools
    • Personalization
    • Authentication
  • Deploy
    • Overview
    • Environment variables
    • WhatsApp
    • Batch calls
  • Monitor
    • Overview
    • Users
    • Testing
    • Experiments
    • Versioning
    • Conversation Analysis
    • Analytics
    • Real-time monitoring
    • OpenTelemetry traces
    • Privacy
    • Cost optimization
    • CLI
  • Advanced
    • Events
    • Custom models
    • LLM cascading
    • Post-call webhooks
  • Resources
    • UI components
  • Guides
    • Chat Mode
    • Burst pricing
    • ElevenLabs' docs agent
    • Scaling user interviews
    • Simulate Conversations
LogoLogo
Login
Login
Connect
BlogHelp CenterAPI PricingSign up
On this page
  • Overview
  • Export surfaces
  • Choosing a surface
  • Post-call webhook
  • Webhook payload
  • Enable OpenTelemetry transcripts
  • Delivery
  • Trace shape
  • GET conversation
  • Monitoring WebSocket
  • Session protocol
  • Trace shape
  • Example connection
  • OTLP JSON structure
  • Limitations
  • Related documentation
Monitor

OpenTelemetry traces

Export OpenTelemetry traces to your observability stack as OTLP JSON.
Was this page helpful?
Previous

Privacy

Manage how your agent handles data storage and privacy.
Next
Built with

ElevenLabs Agents can export conversations as OpenTelemetry traces encoded as OTLP JSON (resourceSpans). Forward them to Datadog, Grafana Tempo, Honeycomb, or any backend that ingests OTLP.

ElevenLabs does not push traces directly to your OTLP collector. You receive OTLP-shaped JSON from a webhook, API, or monitoring WebSocket and forward it to your backend.

Overview

Export traces from three surfaces. All three share the same trace ID per conversation and elevenlabs.* attribute naming. Span shape and timing differ between post-call/GET (transcript-based) and monitoring (event-based).

Export surfaces

SurfaceWhen you get dataBest for
Post-call webhookAfter the conversation ends and analysis completesBatch pipelines, billing and QA, durable storage
GET conversation APIOn demand, after the conversation existsBackfill, debugging, re-processing
Monitoring WebSocketDuring a live conversationLive dashboards, alerting, human-in-the-loop

Choosing a surface

  • Every completed call in your data warehouse: post-call webhook
  • One-off export or repair: GET conversation with format=opentelemetry
  • Live supervisor UI or alerting: monitoring WebSocket
  • Full fidelity timeline after the fact: post-call webhook or GET conversation
  • Tool, MCP, or guardrail events as they happen: monitoring WebSocket

Use traceId or elevenlabs.conversation_id to join data across surfaces. Combine monitoring for live operations, webhooks for durable analytics, and GET for backfill.

You need an OTLP-capable collector or observability vendor for every surface. Post-call webhooks require a workspace webhook endpoint. The GET API and monitoring WebSocket each have their own API key scopes and setup; see the sections below.

Post-call webhook

After a conversation finishes, ElevenLabs sends a POST request when a post-call webhook is configured, events includes transcript, and transcript_format is opentelemetry.

The webhook type is post_call_transcription_otel (not post_call_transcription, which returns JSON transcripts).

Webhook payload

1{
2 "type": "post_call_transcription_otel",
3 "event_timestamp": 1700000000,
4 "data": {
5 "conversation_id": "conv_9001k1zph3fkeh5s8xg9z90swaqa",
6 "agent_id": "agent_7101k5zvyjhmfg983brhmhkd98n6",
7 "otlp_traces": {
8 "resourceSpans": []
9 }
10 }
11}

Enable OpenTelemetry transcripts

Configure via the dashboard
Configure via the CLI
Configure via the API
1

Create a workspace webhook

In the ElevenAgents Dashboard, create a workspace webhook with your HTTPS URL and authentication.

2

Attach the post-call webhook

Open Agents settings, assign the webhook as the post-call webhook, enable the Transcript event, and turn on OpenTelemetry transcript payloads.
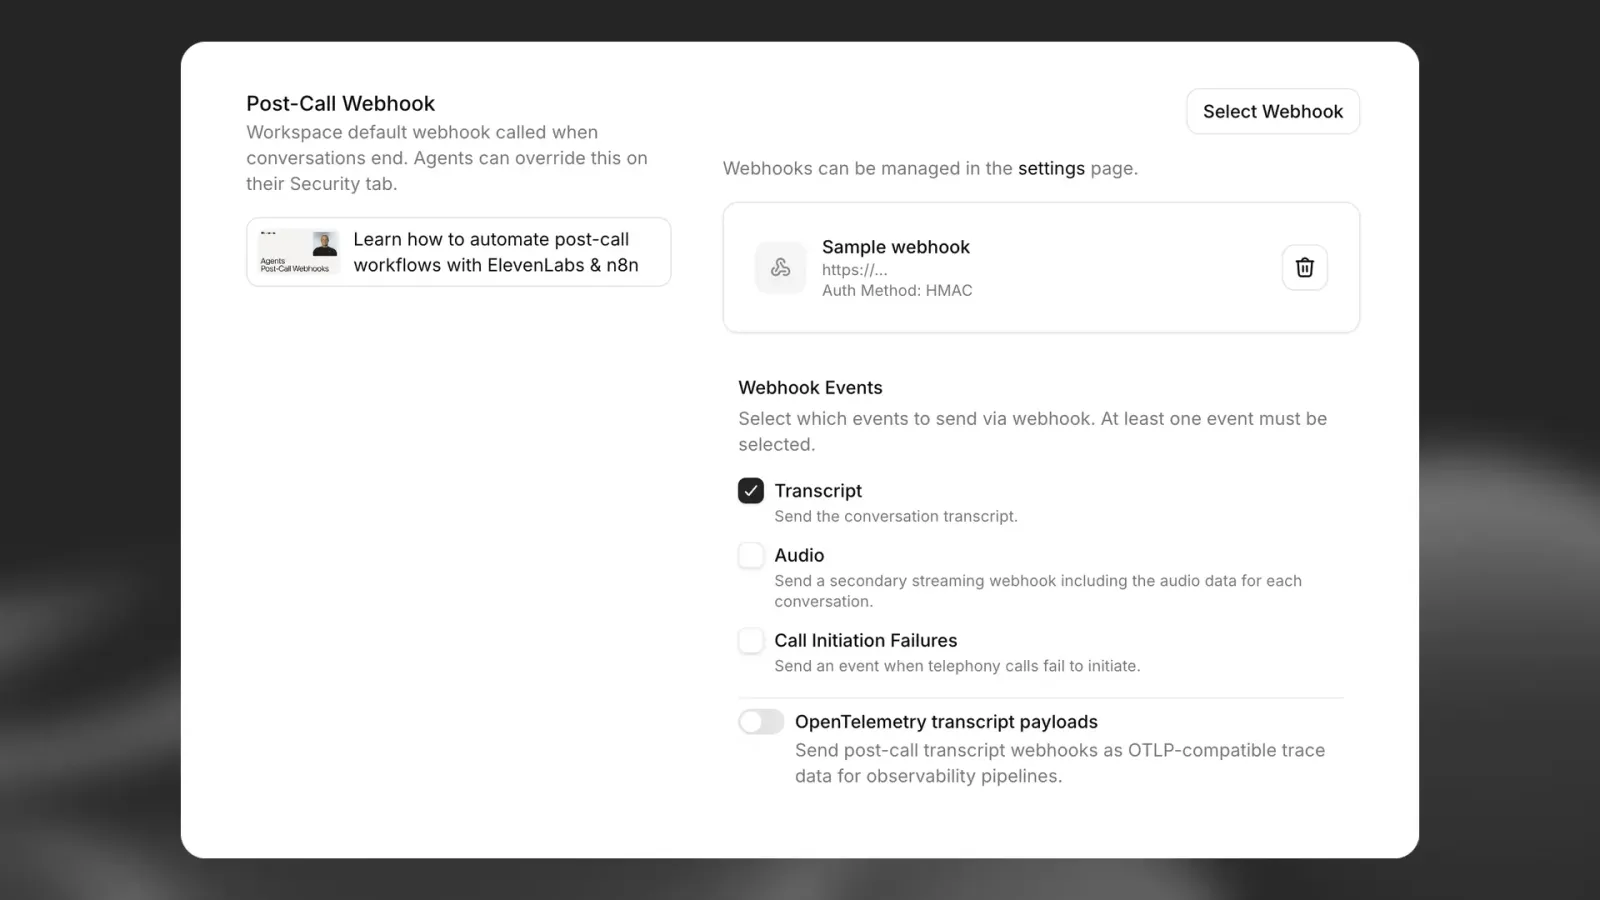
Post-call webhook settings

OpenTelemetry transcript webhooks do not include audio. Use post_call_audio if you need recordings.

Return 2xx for success. 4xx and 5xx count as failures.

Retries apply to transcript webhooks (including OpenTelemetry) only when Enable retries is on for the workspace webhook. Transient errors (5xx, 429, 408) retry up to 5 times; 4xx does not. Audio webhooks are never retried. Repeated failures can auto-disable the webhook. See Post-call webhooks for details and HIPAA exceptions.

Delivery

TopicDetail
MethodPOST with JSON body
AuthElevenLabs-Signature: t={unix},v0={hmac} over {timestamp}.{body}
RetriesTranscript webhooks only; requires Enable retries on the webhook; see warning above
SizeLong tool parameters and results truncate at 4 KB per span attribute

Trace shape

Each delivery is one complete trace: a root span plus children.

elevenlabs.conversation
├── elevenlabs.recv.user_transcript
├── elevenlabs.recv.agent_response
│ └── elevenlabs.tool.{name}
└── ...

Timing comes from transcript time_in_call_secs and call metadata. The root span sets elevenlabs.source = post_call_webhook and status ERROR when the call did not end with a normal client disconnect.

GET conversation

Request OpenTelemetry format on Get conversation to receive the same otlp_traces object as the post-call OpenTelemetry webhook, plus the full conversation model.

1GET /v1/convai/conversations/{conversation_id}?format=opentelemetry

Requires an API key with CONVAI_READ. With format=json (default), otlp_traces is omitted.

1{
2 "conversation_id": "conv_9001k1zph3fkeh5s8xg9z90swaqa",
3 "agent_id": "agent_7101k5zvyjhmfg983brhmhkd98n6",
4 "status": "done",
5 "transcript": [],
6 "otlp_traces": {
7 "resourceSpans": []
8 }
9}
TopicDetail
TimingSame transcript-based builder as the post-call webhook
Transcripttranscript is still returned; otlp_traces is additive
File URLsSigned URLs in span attributes expire after about 15 minutes
1import os
2
3from dotenv import load_dotenv
4from elevenlabs import ElevenLabs
5
6load_dotenv()
7elevenlabs = ElevenLabs(api_key=os.getenv("ELEVENLABS_API_KEY"))
8
9conversation = elevenlabs.conversational_ai.conversations.get(
10 conversation_id="conv_9001k1zph3fkeh5s8xg9z90swaqa",
11 format="opentelemetry",
12)
13
14otlp_traces = conversation.otlp_traces

Expected span names include elevenlabs.conversation, elevenlabs.recv.user_transcript, and elevenlabs.recv.agent_response.

Monitoring WebSocket

Real-time monitoring requires an Enterprise workspace or the realtime-monitoring feature flag. See Real-time monitoring for configuration, control commands, and access requirements.

Stream OpenTelemetry trace data as OTLP JSON while a conversation is in progress. Each message is a small resourceSpans batch, not one end-of-call trace.

wss://api.elevenlabs.io/v1/convai/conversations/{conversation_id}/monitor?events_format=opentelemetry

Authentication requires CONVAI_WRITE, xi-api-key (or Authorization), and EDITOR access on the agent workspace. Connect after the conversation starts.

1

Enable monitoring on the agent

Set monitoring_enabled: true and configure monitoring_events before the call. See Real-time monitoring.

2

Connect with OpenTelemetry format

Append events_format=opentelemetry to the monitoring WebSocket URL.

VAD, turn probability, and ping events are not available when custom monitoring_events are configured. The stream includes text and metadata only, not raw audio.

Session protocol

  1. Connect with authentication headers.
  2. Receive {"type": "connected"}.
  3. Receive a root span batch (elevenlabs.conversation, elevenlabs.source = monitoring).
  4. Receive cached history (around the last 100 events), then {"type": "history_complete"}.
  5. Receive live span batches as events occur.

With events_format=json (default), the WebSocket returns raw client events instead of resourceSpans. Control commands match Real-time monitoring.

Trace shape

elevenlabs.conversation
├── elevenlabs.turn.0
│ ├── elevenlabs.event.user_transcript
│ └── elevenlabs.tool.{name}
└── elevenlabs.turn.1
AspectPost-call and GETMonitoring
GranularityOne trace per webhook or requestMany messages per conversation
Event spansTranscript turnselevenlabs.event.{type}
Turn groupingImplicit in transcript orderExplicit elevenlabs.turn.N
OrderStable transcript orderEvents may arrive out of strict chronological order

Structured events map to dedicated attributes (for example elevenlabs.user.text, elevenlabs.agent.text). Unknown events use elevenlabs.event.data with truncated JSON.

Do not assume event order matches speaking order. Correlate live spans with post-call data using the same traceId.

Example connection

1import WebSocket from "ws";
2
3const ws = new WebSocket(
4 "wss://api.elevenlabs.io/v1/convai/conversations/conv_9001k1zph3fkeh5s8xg9z90swaqa/monitor?events_format=opentelemetry",
5 {
6 headers: {
7 "xi-api-key": process.env.ELEVENLABS_API_KEY!,
8 },
9 }
10);
11
12ws.on("message", (raw) => {
13 const msg = JSON.parse(raw.toString());
14 if (msg.type === "connected" || msg.type === "history_complete") return;
15
16 if (msg.resourceSpans) {
17 forwardToCollector({ resourceSpans: msg.resourceSpans });
18 }
19});

OTLP JSON structure

OpenTelemetry traces from all surfaces share the same OTLP JSON batch layout:

1{
2 "resourceSpans": [
3 {
4 "resource": {
5 "attributes": [
6 { "key": "service.name", "value": { "stringValue": "elevenlabs-convai" } },
7 {
8 "key": "elevenlabs.conversation_id",
9 "value": { "stringValue": "conv_9001k1zph3fkeh5s8xg9z90swaqa" }
10 }
11 ]
12 },
13 "scopeSpans": [
14 {
15 "scope": { "name": "elevenlabs.convai", "version": "1.0.0" },
16 "spans": [
17 {
18 "traceId": "32_hex_chars",
19 "spanId": "16_hex_chars",
20 "name": "elevenlabs.recv.agent_response",
21 "startTimeUnixNano": "1700000000000000000",
22 "endTimeUnixNano": "1700000001000000000",
23 "status": { "code": 1 }
24 }
25 ]
26 }
27 ]
28 }
29 ]
30}

Limitations

  • No direct push to your OTLP gRPC endpoint.
  • Payloads are JSON shaped like OTLP export, not raw protobuf on the wire.

Related documentation

  • Post-call webhooks
  • Real-time monitoring