Usage analytics
The Developers page provides comprehensive tools to monitor and analyze your platform activity.
To access these tools, navigate to the Developers page (found at the bottom of the sidebar in both ElevenAgents and ElevenCreative).
The Developers page includes several tabs:
- Usage: View and filter usage data for your account or workspace
- Analytics: Collect, view, and filter workspace activity including API requests, usage metrics, and webhooks
- Request Log: View and filter specific API requests for debugging and monitoring
If you’re part of a multi-seat workspace, you’ll see a toggle to switch between data for your account and your workspace.
Usage tab
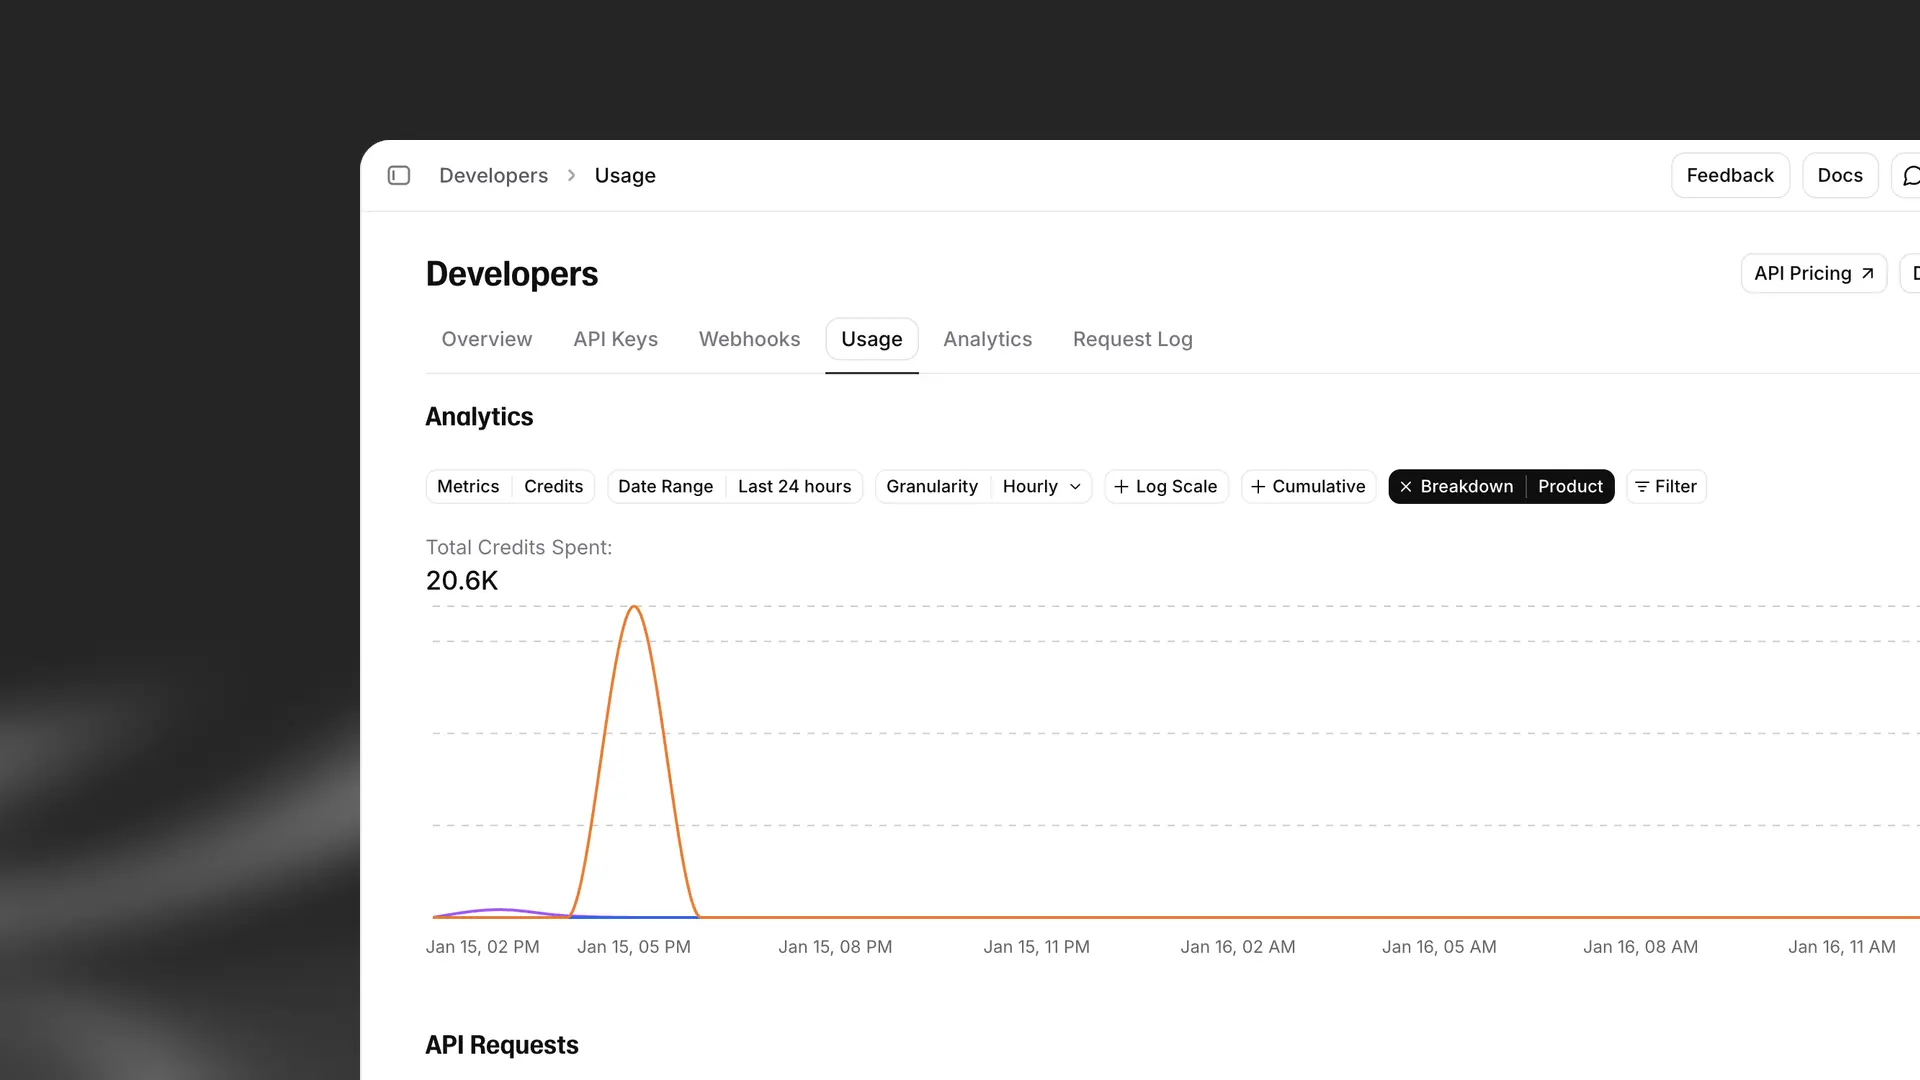
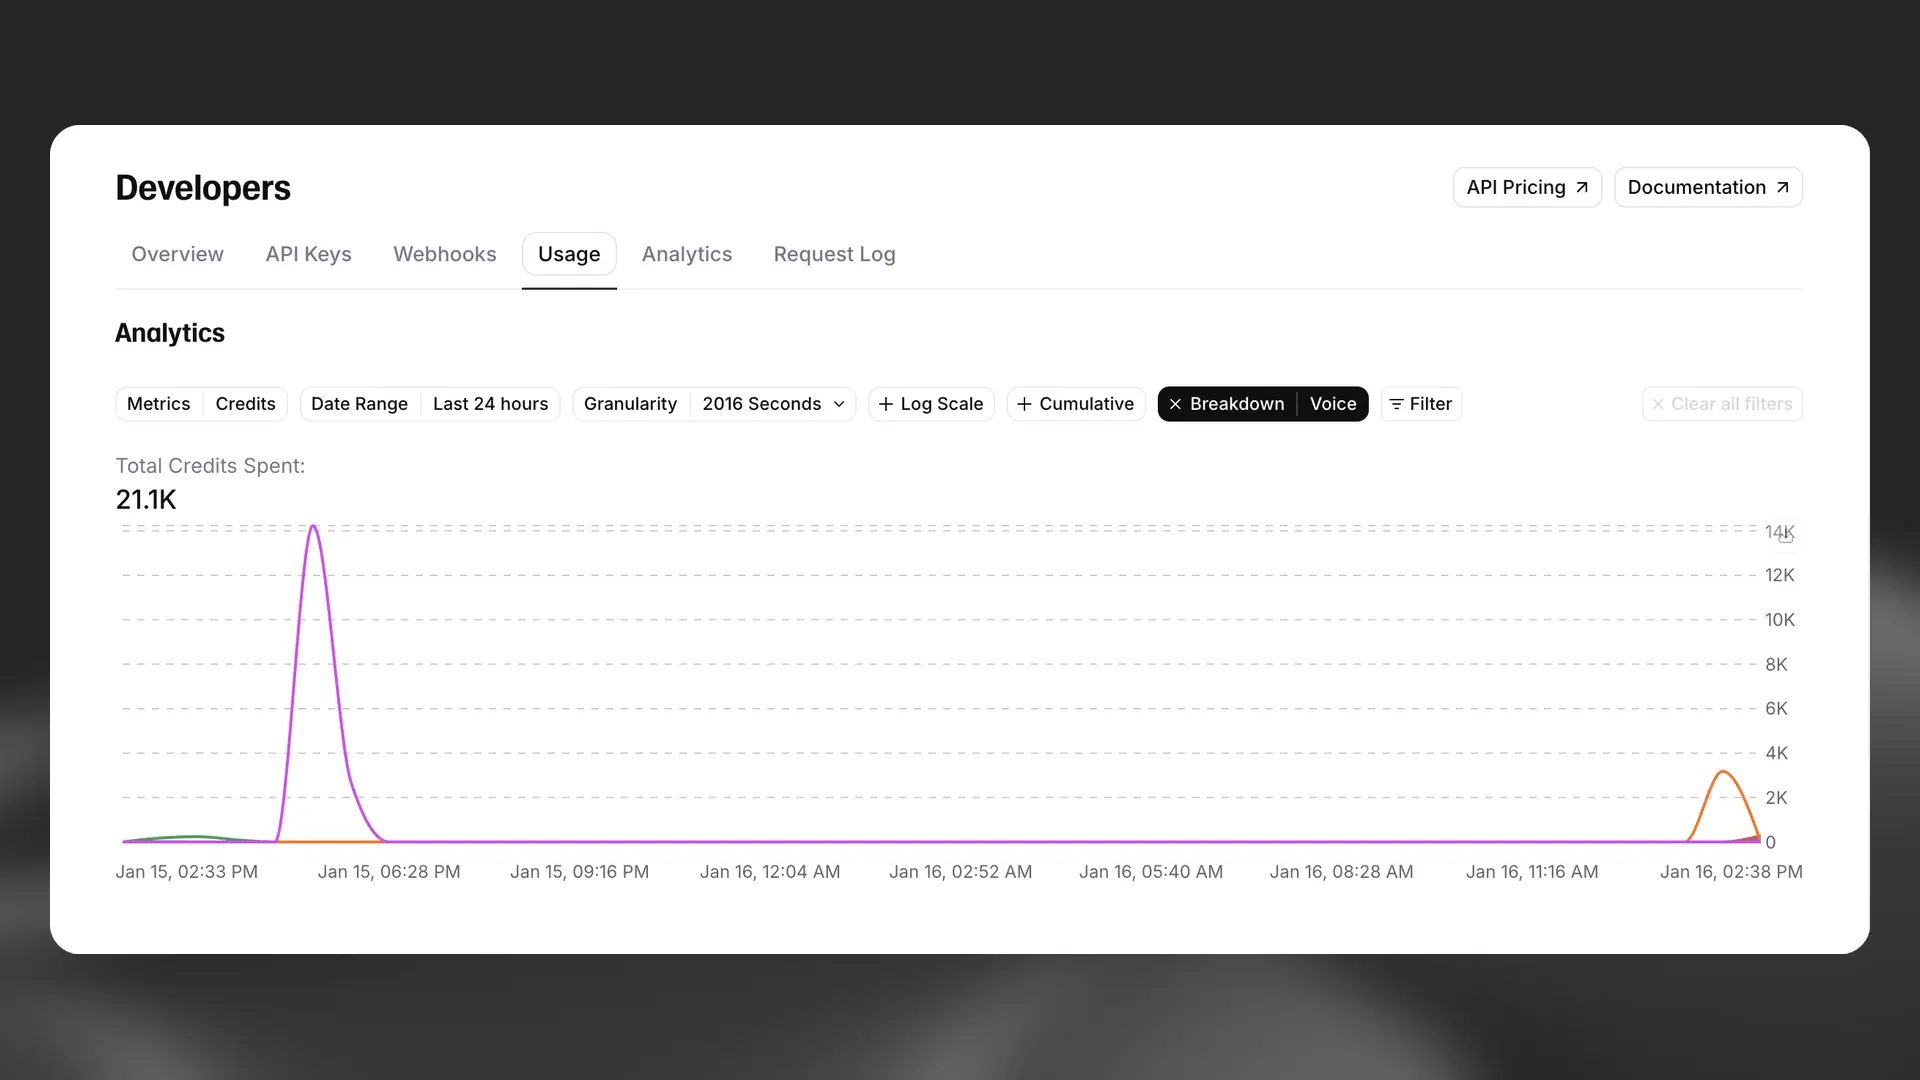
The Usage tab allows you to choose from a range of metrics for analysis, including credits, and filter your usage data in a number of different ways.
You can break your usage down by voice, product, or API key. If you’re viewing workspace usage, you have additional options allowing you to break usage down by individual user or workspace group.
You can view the data by day, week, month or cumulatively. If you want to be more specific, you can use filters to show only your usage for specific voices, products or API keys.
This feature is quite powerful, allowing you to gain great insights into your usage or understand your customers’ usage if you’ve implemented us in your product.
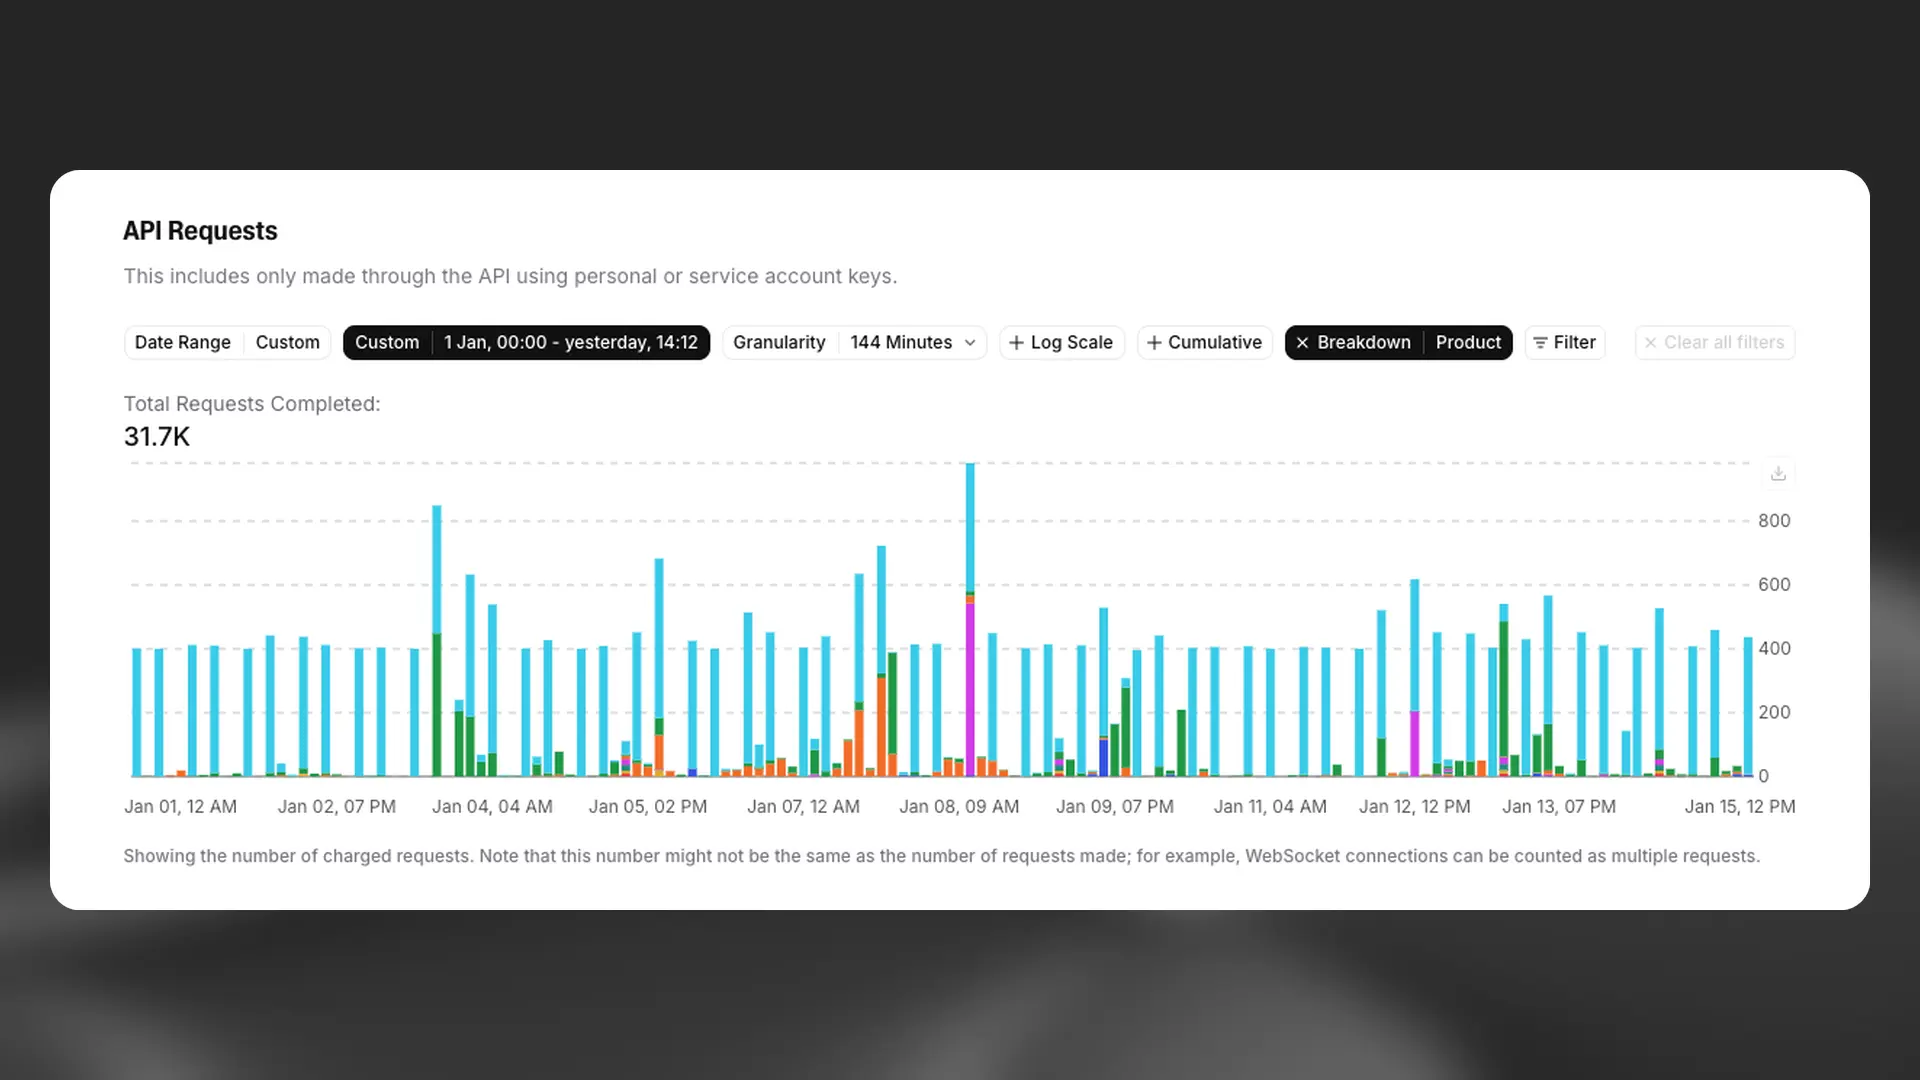
In the API Requests section, you’ll find not only the total number of requests made within a specific timeframe but also the number of concurrent requests during that period.
You can view data by different time periods, for example, hour, day, month and year, and at different levels of granularity.
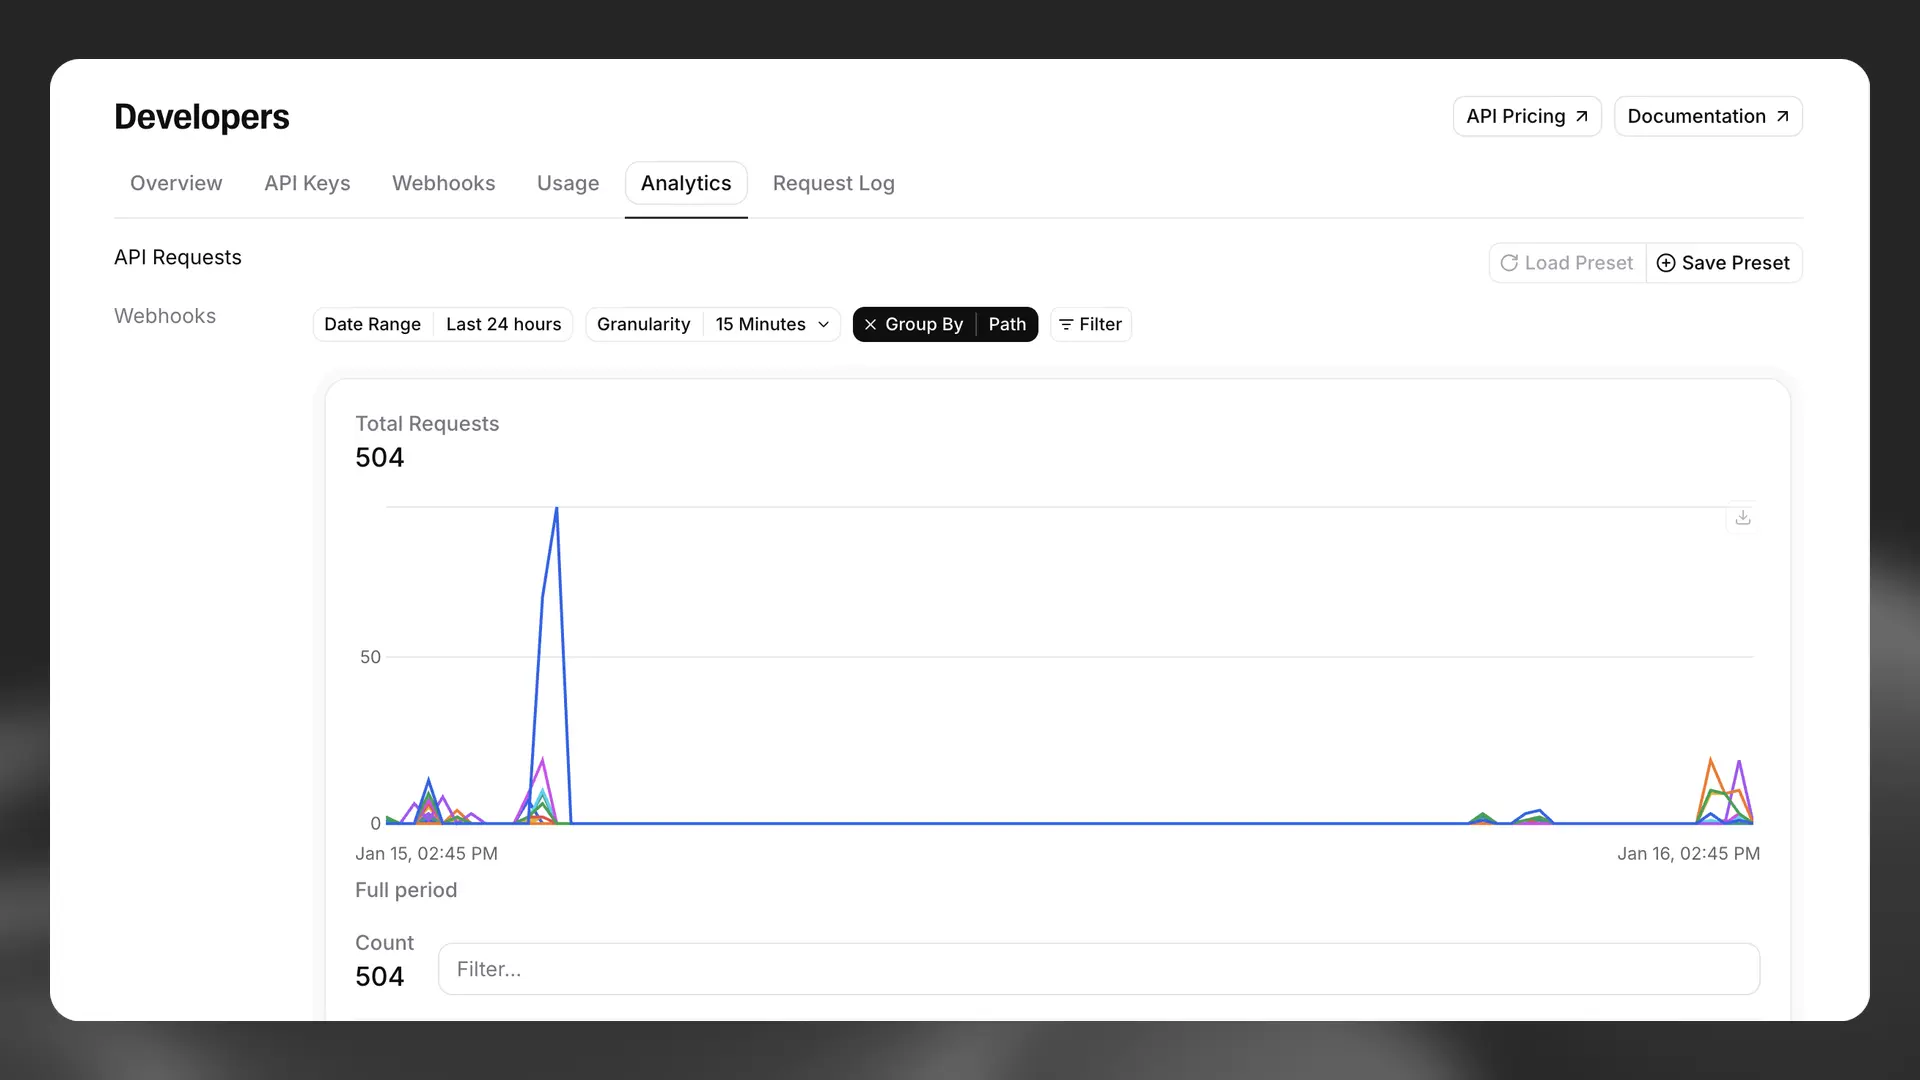
Analytics tab
The Analytics tab provides detailed insights into workspace API requests and webhooks. You can filter and analyze data by different time periods (hour, day, month, year) and at different levels of granularity. You can also monitor success rate and average latency for your API requests.
Request Log
The Request Log tab allows you to view and filter specific API requests for debugging and monitoring purposes.
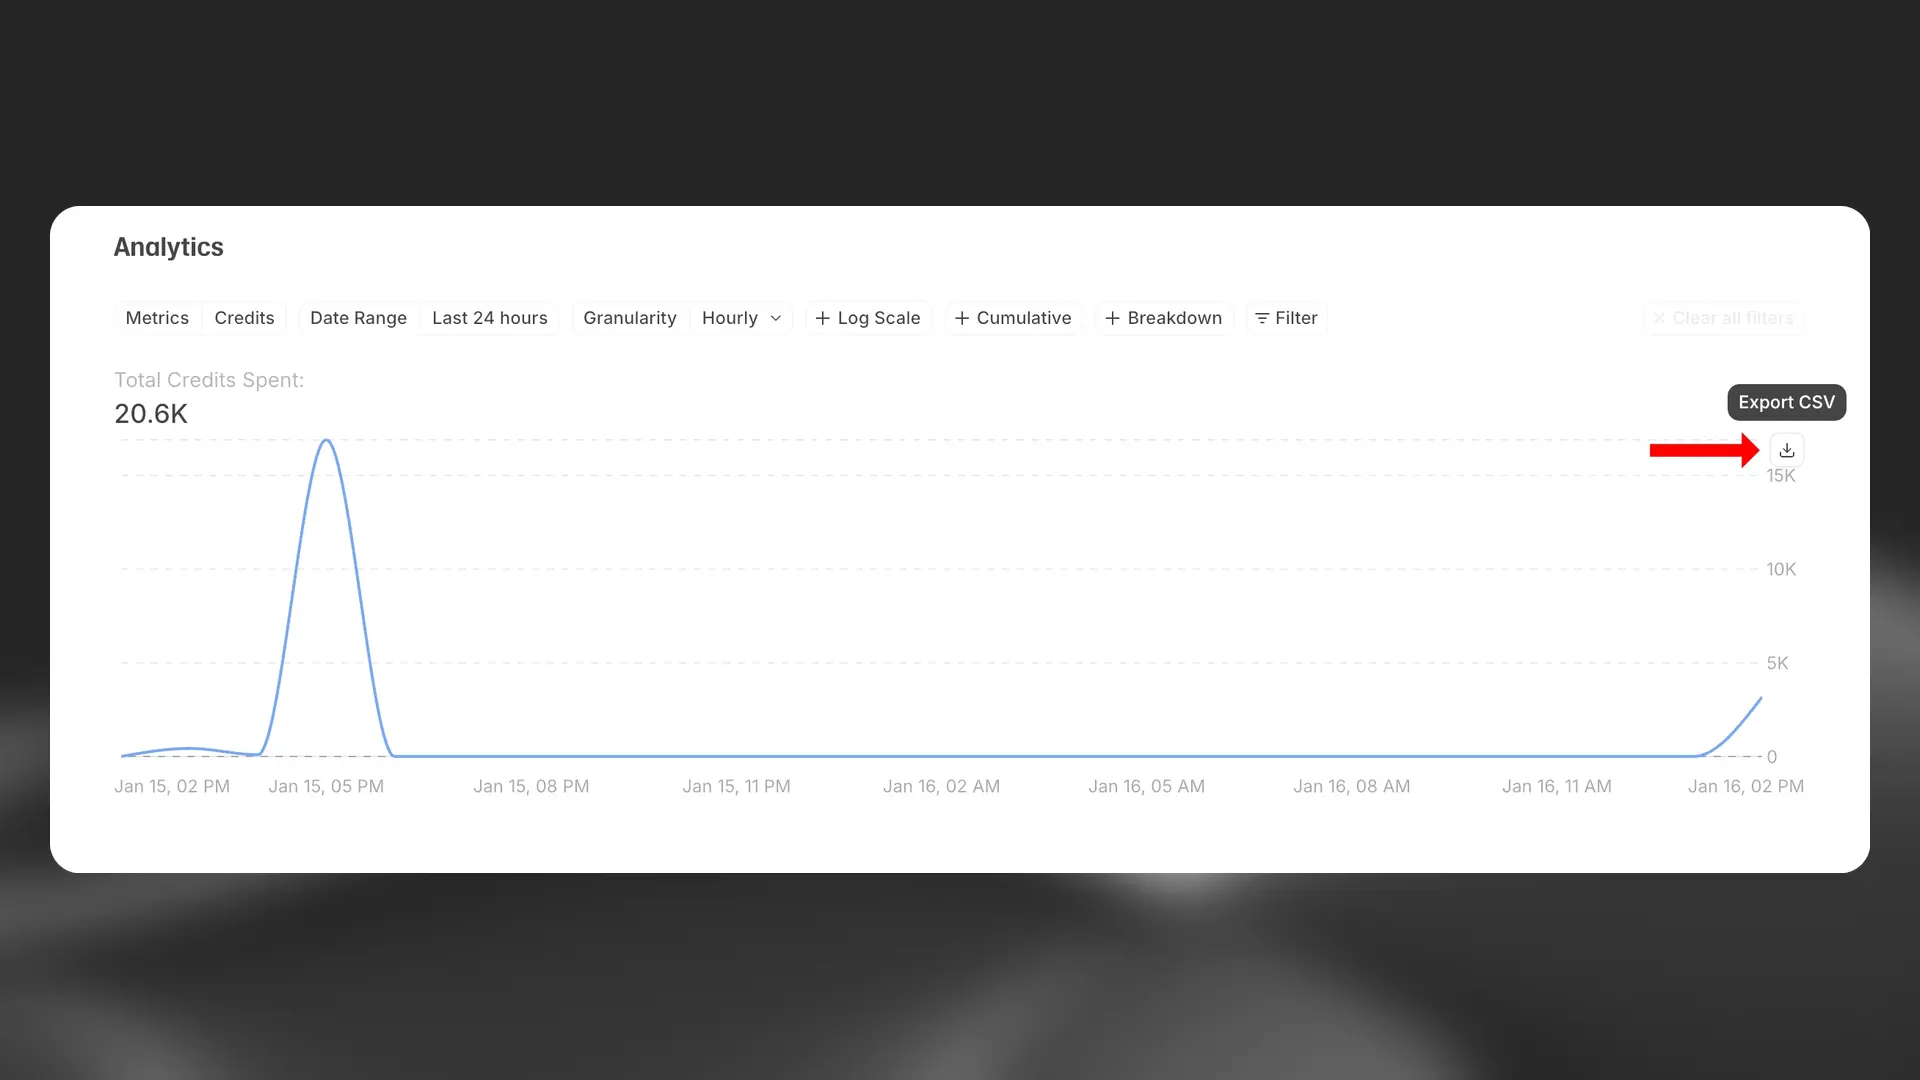
Export data
You also have the option to export your data as a CSV file. To do this, just click the “Export as CSV” button, and the data from your current view will be exported and downloaded.